Core System v1.5.0: the full recipe and the numbers behind it
My Core System has evolved significantly over the past year.
Core System v1.5.0: Achieving true non-correlation
My Core System has evolved significantly over the past year. By adding a Connors RSI2 mean-reversion sleeve to the existing trend-following logic, I have finally broken through the performance ceiling I hit back at version 1.4.0.
The latest performance snapshot
The addition of the Connors RSI2 strategy (buying dips when the price is above the 200-day moving average and RSI is below 10) provides a return profile that is truly uncorrelated with my trend-following core. The correlation coefficient is a mere +0.03, which allows me to combine them to lower the drawdown (DD) and re-leverage for higher gains.
| Metric | v1.5.0 | v1.4.1 |
|---|---|---|
| Monthly Return | +0.90% | +0.82% |
| Max Drawdown | -9.4% | -9.6% |
| PF (Profit Factor) | 1.64 | 1.69 |
| MC (Monte Carlo) | 96.4% | 94.7% |
| Winning Years | 10/11 | 9/11 |
| In other words, by diversifying into a sleeve that moves independently of the main trend, I improved the monthly return by 10% while simultaneously reducing the drawdown and increasing the statistical robustness. |
Evolution of the Core System
The journey to v1.5.0 was built on a series of systematic refinements. Each addressed a specific bottleneck in the system’s performance.
- v1.4.1 (Trend Filtering): I added a daily timeframe filter to the H1/H4 breakout logic. By only taking trades in the direction of the daily trend, I reduced the trade count by 16% while improving the quality of entries. This proved that simply stacking indicators often hurts performance, but a well-placed structural filter can raise the profit factor.
- v1.4.0 (Equity Filtering): I introduced an inter-market signal where the system scales down FX risk if the US500 index drops below its 200-day moving average. This uses the stock market as a “canary in the coal mine” to detect risk-off environments before they hit my FX positions.
- v1.3.0 & v1.3.1 (Volatility Targeting): I implemented volatility targeting, which automatically adjusts lot sizes based on recent realized volatility. This acts as a dampener during choppy markets to prevent large losses during unstable periods.
Stress testing and robustness
One of my primary goals is ensuring this system can pass professional prop-firm evaluation rules. I have conducted rigorous M1 intraday stress testing by rebuilding the account equity from 1-minute bars to simulate worst-case scenarios. Across all assets (US500, US30, JP225, UK100, and major FX pairs), the worst single-day loss recorded was 1.93% for indices and 2.42% for FX. These figures include volatile periods like the COVID crash. The system has maintained a 0-day failure rate under these stress conditions. The current configuration is now finalized, and all five sleeves are implemented in the MT5 code. The results confirm a long-standing hypothesis: the only path to meaningful drawdown reduction is the addition of non-correlated, positive-EV (expected value) sleeves. While I previously believed there was a performance ceiling around 0.5% monthly return, this multi-sleeve approach has successfully pushed that boundary higher.
How this connects
This verification builds on earlier ones (what failed before and what I tried this time, comparisons between approaches).
- Swapping one entry rule improved every metric
- Every way to raise monthly returns, listed and tested
- The first genuinely uncorrelated return stream I found
- Can filters rescue short-timeframe trend trading?
- An index sleeve broke my 0.47% monthly ceiling, then shorting…
- Turning support and resistance importance into a number
- Chasing 3% a month means a 70% drawdown, and every smart…
- Global index diversification: the ceiling did not move
- Volatility-scaled sizing: the first upgrade that was actually…
- Five times I doubted the system that won 10 of 11 years, five…
Verification data
Key figures and charts measured by running this on real data.
| Item | Value |
|---|---|
| Symbols | robust5 (XAUUSD + 4 JPY crosses) + stock indices (US500/100/30) + Connors (indices+FX) |
| Timeframes | H1 / H4 / D1 |
| Period | 2015-2026 |
| Risk settings | risk0.003 / index0.004 / sat2 0.003 / connors0.006 |
| Gates | full forward test -> M1 intraday risk -> Monte Carlo -> consistency (prop rules) |
Key metrics
| Metric | Value |
|---|---|
| Total return | +239.1% |
| Monthly (compound) | +0.93% |
| Max drawdown | -9.4% |
| Profit factor | 1.64 |
| Sharpe | 0.34 |
| Winning years | 10/11 |
| MC pass rate (overall) | 96% |
| Trades | 5960 |
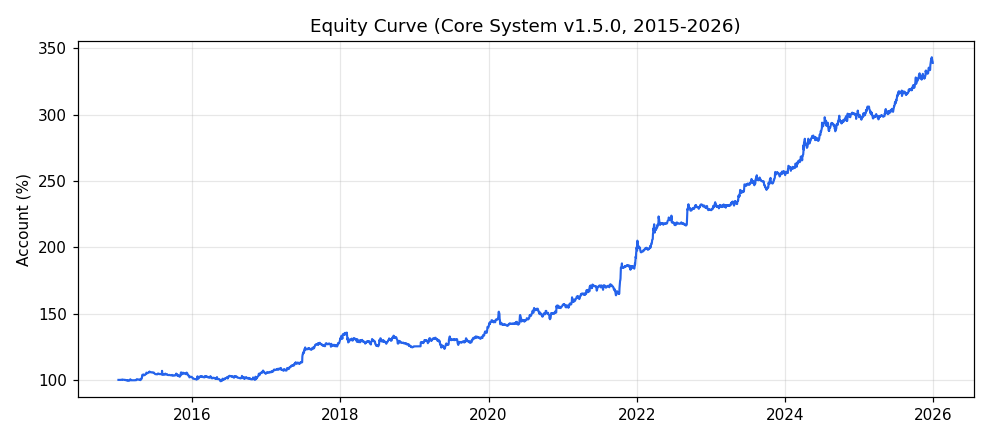
Equity curve (account %)
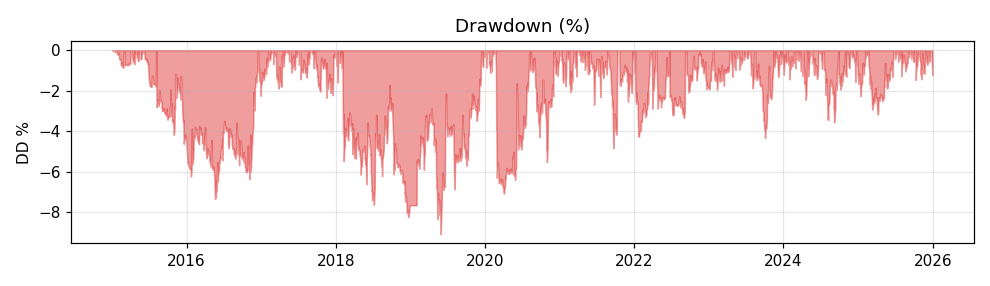
Drawdown (%)
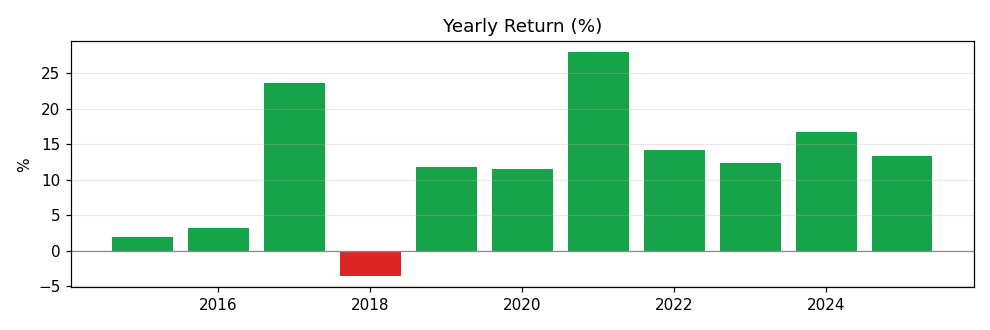
Yearly return (%)