
That popular 4H EMA-cross method? It tested out fake
I recently built a new tool to automate the extraction of trading rules from YouTube videos using the Gemini API.
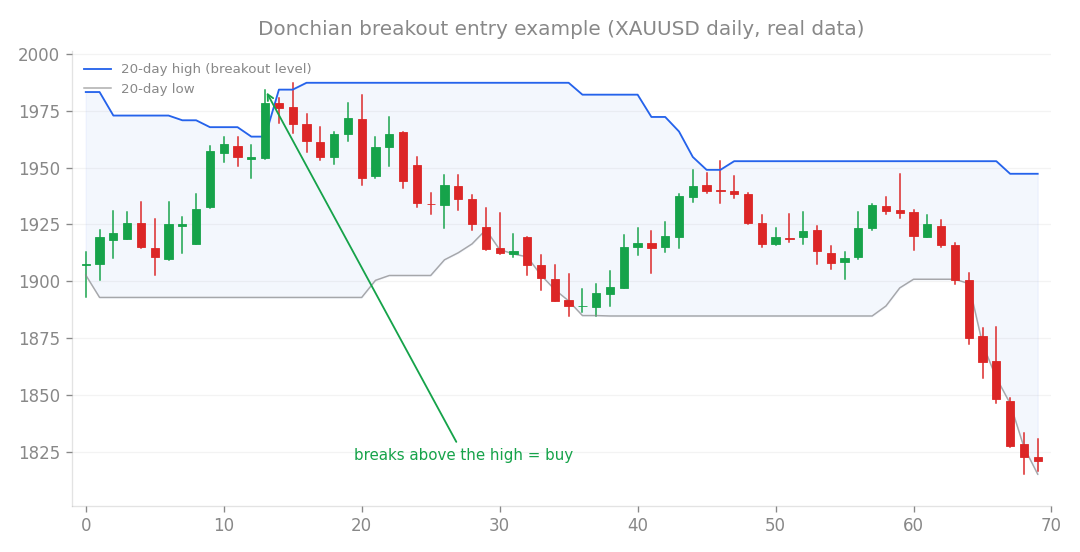
Breakout entry example (XAUUSD daily, real data): buy when price breaks above the recent high.
I recently built a new tool to automate the extraction of trading rules from YouTube videos using the Gemini API. By converting video explanations into structured JSON, I can now mechanically test strategies without the bias of human interpretation. My first subject was a popular “Elliott Wave 3” style strategy: waiting for a 20/200 EMA cross, followed by a pullback to the 20 EMA, and entering on a breakout of that trigger candle.
Initial results were deceiving
When I ran a walk-forward test (a method where the system is optimized on one period and tested on the next), the results for the “both directions / fixed 2R target” variant were unexpectedly strong. It showed a +9.5% return and was profitable in 5 out of 6 years. In other words, it passed my initial robustness gate. Given my past experience with similar strategies, I expected it to fall apart, yet the numbers suggested it was a viable candidate. This triggered a red flag in my workflow, so I moved it to my secondary screening process to see if it was a “false positive.”
| Strategy Variant | Return | Performance (Years) |
|---|---|---|
| Both directions / Swing | -6.7% | 2/6 |
| Long only / Swing | +0.2% | 2/6 |
| Long only / 2R target | +0.9% | 1/6 |
| Both directions / 2R target | +9.5% | 5/6 |
Why it failed the secondary screening
The secondary screening, which tests for parameter and timeframe robustness, quickly dismantled the strategy. It failed on two critical fronts:
- Parameter Sensitivity: When I tweaked the EMA periods or wait times, the strategy’s performance became erratic. Unlike truly robust systems where performance remains stable across various settings, this one turned negative or showed poor win rates in 8 out of 12 variations.
- Timeframe Collapse: This was the definitive failure. While it looked decent on the 4H chart, it collapsed on the 1H chart with a -25.2% return and flatlined on the Daily chart at -0.3%. In my experience, genuine market edges like those found in breakout or trend-following systems tend to persist across multiple timeframes. This strategy only worked on the 4H chart, which indicates that it is simply “overfitting” to the specific noise structure of that timeframe.
Conclusion on the strategy
The strategy is a false positive and is not deployable. It highlights the importance of my multi-stage screening process: the system correctly identified that the “success” seen in the initial walk-forward test was a mirage. Once the human “discretionary” elements mentioned in the video (such as avoiding ranges or picking “prominent” highs) were removed, the mechanical skeleton had no edge left. I also tested a short-only version of this strategy on metals, as suggested by another video. It failed across every variant I tested. The reality is that the strategy’s core logic is flawed, and applying it to metals or short-selling only confirms the lack of a real edge. While the strategy itself is a bust, the new extraction tool is a permanent success for my research; I now have a reliable way to quickly filter through online claims before risking any real capital.
How this connects
This verification builds on earlier ones (what failed before and what I tried this time, comparisons between approaches).
- The gold strategy that won on every setting, then dropped 7.2%…
- A +33.8% backtest fell to -3.0% in walk-forward: all three…
- The textbook trendline-break setup, quantified and tested
Code to reproduce
You can reproduce this with the following scripts (see repo).
scripts/tools/youtube_extract.py