Better trade quality, same profits: a textbook non-upgrade
Adding filters to a breakout strategy improves trade quality, but it rarely creates a new, independent edge.
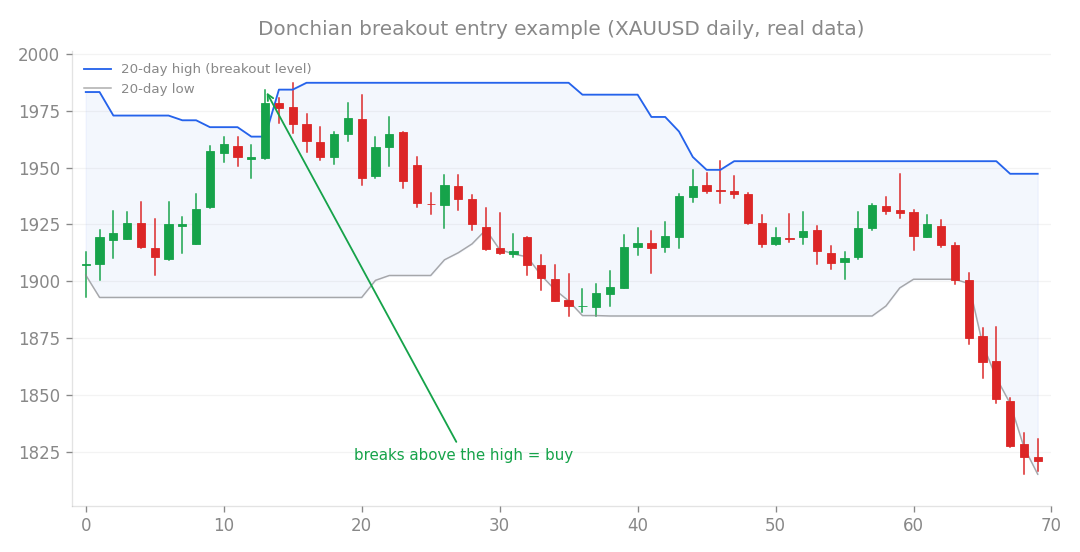
Breakout entry example (XAUUSD daily, real data): buy when price breaks above the recent high.
Adding filters to a breakout strategy improves trade quality, but it rarely creates a new, independent edge. My latest research into a “Continuation Breakout” model confirms that while these systems look promising in initial testing, they ultimately just mimic existing trend-following logic.
The Hypothesis
I tested a system designed to catch breakouts following a period of consolidation. The rules were:
- The market must be in an uptrend (price above the SMA).
- Recent price action must show a range (ADX below a set threshold).
- The trade triggers on a breakout from that range.
- The higher timeframe (H4 SMA) must also be trending upward.
- The breakout must occur near a significant horizontal price level. I compared this against a “plain” breakout model, which is essentially a raw entry without these extra filters, to see if the added complexity actually provided an advantage.
In-Sample vs. Out-of-Sample Performance
In the initial in-sample testing (fitting the model to historical data), the results were encouraging. Adding these filters improved the Profit Factor (PF) from 1.06 to 1.14 and reduced the maximum drawdown from 21% to 14%. In other words, the filters successfully weeded out low-quality trades. However, the reality shifted during forward testing (OOS), where I evaluated the system on data it hadn’t seen before.
| Model Variant | OOS Performance | Robustness (Years) |
|---|---|---|
| Plain Breakout | +24.4% | 3/6 |
| Range Filter Only | -0.3% | 2/6 |
| Range + MTF Filter | +18.2% | 4/6 |
| Range + MTF + Level | +32.9% | 4/6 |
| While the full model achieved the best return, the improvement over the plain breakout was marginal and likely due to selection noise. Furthermore, the correlation between the plain model and this filtered version was +0.83. This high correlation suggests they are essentially the same strategy; they just enter the market at slightly different times. |
Testing Alternative Filters
I also experimented with three variations of this model to see if I could find a more robust edge:
- Diagonal Channels: Performed worse than horizontal levels (4/6 robustness), reinforcing my previous findings that horizontal levels remain superior for this type of strategy.
- Volatility Contraction (NR): This looked attractive initially, hitting 5/6 on robustness. However, it failed under deeper stress testing. The high correlation (+0.86) and an M1 intraday worst-case loss of 7.64% (caused by price gaps after the volatility squeeze) revealed it was just another variation of the same trend-following edge.
- Early Entry: This increased in-sample returns but failed to maintain consistency in forward testing.
Final Verdict
The “Continuation Breakout” logic is a valid way to capture price action, but it does not provide a new, independent source of profit. The initial success of the volatility-based variant was a classic example of multiple testing noise, which my verification framework caught during the later stages of stress testing. Because these variants are so highly correlated with my existing trend-following systems, adding them would not provide any real diversification. I will keep the code for the base strategy as a potential alternative entry method, but I am making no changes to my current trading system. The current framework is working exactly as intended by filtering out these “false” independent edges.
How this connects
This verification builds on earlier ones (what failed before and what I tried this time, comparisons between approaches).