Range bars looked profitable. It was an artifact of the bars themselves
Range bar breakouts are a classic example of a system that looks perfect on paper but fails upon deeper inspection.
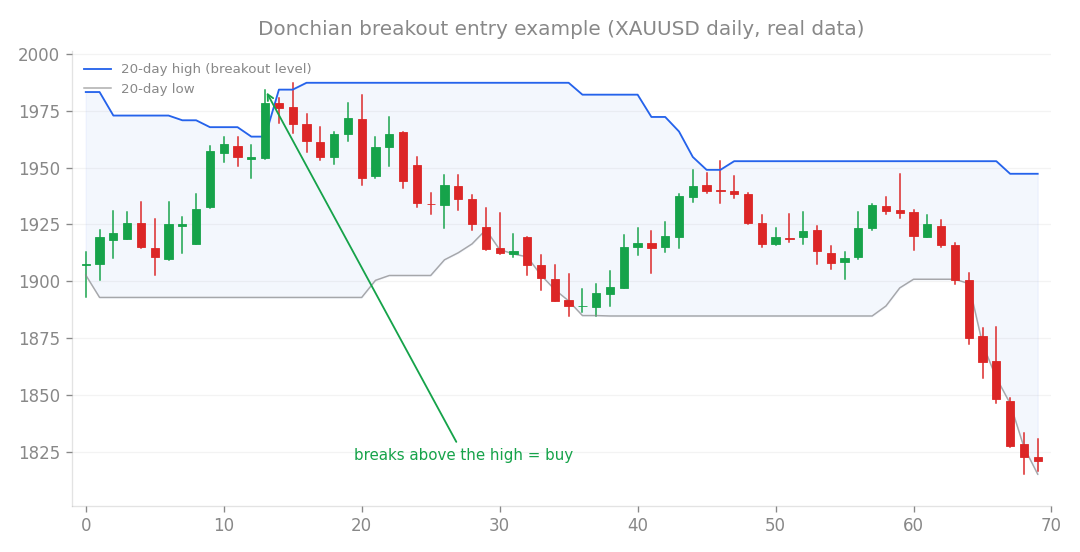
Breakout entry example (XAUUSD daily, real data): buy when price breaks above the recent high.
Range bar breakouts are a classic example of a system that looks perfect on paper but fails upon deeper inspection. I recently tested a strategy using range bars (charts constructed by price movement rather than time) to filter out market noise. By converting M15 time-based charts into ATR-based range bars and applying a long-only Donchian channel breakout, the results were incredible. Across every symbol I tested, the Profit Factor (PF) hit between 2.0 and 2.7; this is the ratio of gross profit to gross loss, where anything over 1.0 is profitable. This significantly outperformed the standard time-based versions of the same strategy, which typically hover around a 1.2 to 1.4 PF. In other words, the strategy looked too good to be true. My suspicion grew when symbols known for having little to no edge, like EURUSD and AUDUSD, performed just as well as everything else. To get to the bottom of this, I ran a control test using a random walk: a data series with absolutely no edge or predictive power. The results were startling. The same range bar strategy produced a PF of 3.2 to 3.75 on purely random data, which was actually higher than the results from the real market symbols. This confirms that the high performance I observed was a structural artifact. Specifically, the way range bars are constructed based on the closing price, combined with the logic of a Donchian breakout, creates a look-ahead bias. The algorithm essentially “sees” the future price movement because the bar formation and the breakout signal are triggered by the same price data point. Even when I restricted the system to one breakout per bar, the bias remained. My conclusion is that range bar breakouts are a false positive. Whenever I develop a new strategy, I now ensure it is tested against a random walk placebo. This has become a standard part of my research workflow, sitting alongside my previous work on gold scalping and machine learning models, both of which also turned out to be false positives. I will not be moving forward with this system, as it relies on a structural bias rather than a genuine market edge. The lesson here is clear: any system that relies on reconstructing price bars is prone to creating its own artificial, phantom profitability.
How this connects
This verification builds on earlier ones (what failed before and what I tried this time, comparisons between approaches).