
Connors RSI2: the first mean reversion that truly added returns
After finalizing v1.4.1, I began exploring a new logic track to supplement the existing system.
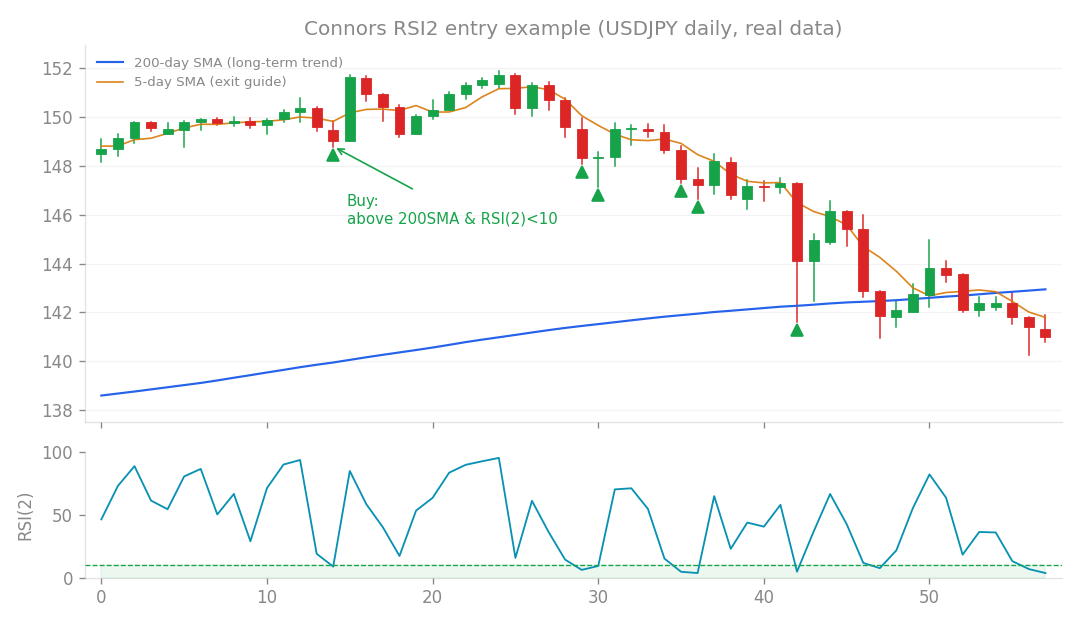
Connors RSI2 entry example (USDJPY daily, real data): buy the dip when price is above the 200-day SMA and RSI(2) falls below 10.
Developing the Connors RSI2 Mean Reversion Sleeve (v1.5.0)
After finalizing v1.4.1, I began exploring a new logic track to supplement the existing system. The goal was to build a standalone system around the Connors RSI2 (a mean reversion indicator), which was the only non-trend edge to pass my forward testing. The logic follows a classic Connors long setup: price must be above the 200-day simple moving average (SMA), the RSI(2) must be below 10, and the exit triggers when the price crosses back above the 5-day SMA, using an ATR-based stop.
Universe Screening and Portfolio Performance
I tested this strategy across 26 symbols to find which ones held up. 15 symbols showed a Profit Factor (PF) above 1.05 and maintained a correlation near zero with my core trend-following system.
| Metric | Portfolio (15 symbols, 0.5% risk) |
|---|---|
| Monthly Return | +0.25% |
| Drawdown (DD) | -5.8% |
| Profit Factor (PF) | 1.44 |
| Sharpe Ratio | 1.04 |
| Core Correlation | +0.03 |
| The Sharpe Ratio (a measure of risk-adjusted return) of 1.04 is a significant improvement over the core’s usual 0.3. |
Robustness and Forward Testing
To ensure the results weren’t just a product of overfitting, I used a forward-testing method. I selected the 11 best-performing symbols based on In-Sample (IS) data from 2015 to 2020 and applied them to unseen Out-of-Sample (OOS) data from 2020 to 2025. The OOS results confirmed the strategy is genuine:
- Monthly Return: +0.17%
- DD: -3.0%
- PF: 1.38
- Sharpe Ratio: 0.94
Integration with Core v1.4.1
The real test was whether this sleeve would actually improve the existing system when running in parallel. By combining the results, the improvement was clear:
- Core v1.4.1 alone: Monthly +0.84%, DD -9.6%, MC95% (Monte Carlo pass rate).
- Core + Connors (0.5% risk): Monthly +0.91%, DD -9.3%, MC96%. In other words, adding this sleeve increased returns while simultaneously decreasing the drawdown and raising the Monte Carlo pass rate. Furthermore, testing the M1 intraday worst-case loss (which simulates the maximum possible loss in a single day using 1-minute data) showed no change at 2.42%. This confirms that the mean reversion logic does not stack risk on top of the core system’s intraday volatility.
Conclusion and Implementation
This is the first time since v1.4.0 that I have genuinely managed to improve the system’s performance ceiling. By utilizing a full portfolio of indices and FX pairs selected through forward testing, I have finally realized the “non-correlated positive expectancy sleeve” I identified as necessary for scaling. I have officially promoted this to v1.5.0. The system is implemented in MT5 with full backward compatibility. Setting the Connors risk parameter to 0 reverts the system to the v1.4.1 configuration. I recommend a risk setting between 0.005 and 0.008 for this new sleeve. The next step is a live demo forward test.
How this connects
This verification builds on earlier ones (what failed before and what I tried this time, comparisons between approaches).